

Published: September 6, 2023
Pendle operates on 4 networks, enabling the permissionless tokenization and trading of yield. It allows anyone to purchase assets at a discount, and obtain a fixed yield, or long DeFi yield.
This report covers the period September 1 to September 30.
Key Performance highlights: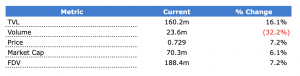
We have removed Avalanche from the overall metrics from this cycle onwards. This is because the share of the protocol present on the Avalanche network is relatively insignificant, and development on this front has been discontinued.
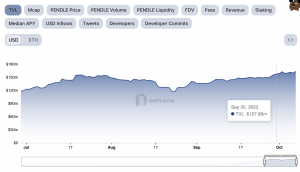
Pendle opened at $138m and closed at $160.2m, a $22.2m (16.1%) increase over the period. The 60-day rolling average for TVL also has an increasing trend. The $100.5m in TVL on Ethereum represents 62.8% of total protocol TVL.
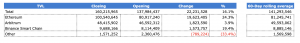
At a network level, Ethereum had a decrease of 5.3% in TVL.
Events impacting TVL: The increase in Ethereum was most likely due to the new vaults released for $OETH, $sDAI, $ETHx, and $eUSD. See the News section for more info.
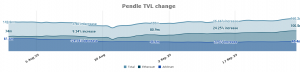
The increase in TVL during this period actually represents an All-Time High (ATH) in TVL, in both $ETH and USD terms. On the final days of the period, TVL climbed up towards $157M, past the previous ATH of ~$156M in July.
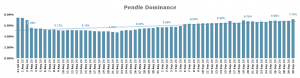
Pendle ranks 3rd of all the Competitor protocols.
Competitor dominance opened with 5.7% and increased over the period, closing at 7.16%.
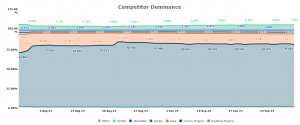
 Source: TVL data – DeFiLlama and Pendle Analytics
The total volume traded was $23.6m. The highest daily total was $1.2m on 01 Sep and the low of $0.5m was recorded on 30 Sep.
This was a $11.2m (32.2%) decrease from the $34.8m of the previous period.
The average Capital Efficiency achieved was 0.54%, up from 0.25% last period, a 116% increase.
The graph below illustrates the daily volume (at a network level) and the capital efficiency of the protocol.
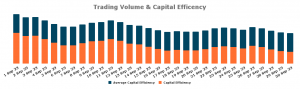
*Capital Efficiency is an indicator of how efficiently TVL in liquidity pools generates volume. It is calculated by taking the volume divided by TVL and converted to a percentage. It is a measure of how productive funds are at generating volume, but it is not a direct indicator of revenue. Higher capital efficiency does not mean higher revenue
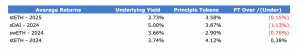
On September 30th the largest liquidity pools were:
Holding the Principal Token (PT) enables you to redeem the principal amount after maturity; one PT can be redeemed for one underlying unit at maturity.
When it comes to trading PT tokens:
It is important to remember that, while the implied yield for PT changes, you lock in the rate at the time of purchase.
You can find out more about PT tokens in our Pendle Breakdown.
The chart below illustrates your position if you acquired a PT token on the respective day for each of the four largest pools.
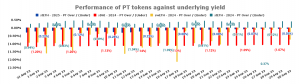
A positive percentage: means that the implied yield was greater than the underlying yield, therefore traders would have been better off purchasing the PT compared to the underlying asset. The opposite is true for negative percentages
Please note: The profit and loss spreads only apply if traders hold until maturity.
The key takeaways are:
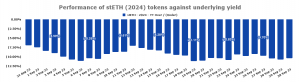
Holding the Yield Tokens (YT) enables users to continuously earn the yield produced by the underlying asset. It can be claimed in real-time up until maturity.
When it comes to trading YT tokens:
It is important to remember that YT tokens earn the yield of the underlying asset.
You can find out more about YT tokens in our Pendle Breakdown
The chart below illustrates your position if you acquired a YT token on the respective day for each of the four largest pools.
A positive percentage: means that the underlying yield was greater than the implied yield, therefore traders had a higher likelihood to make a profit. The opposite is true for negative percentages.
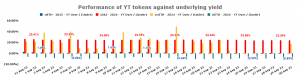
A positive percentage: means that the underlying yield was greater than the implied yield, therefore traders had a higher likelihood to make a profit. The opposite is true for negative percentages.
The key takeaways are:
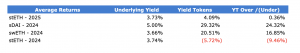
$PENDLE opened the period at $0.68 and closed at $0.729, a 7.2% increase.
The high for the month was $0.73 recorded on 30 Sep, while the low of $0.55 was on 12 Sep.
Comparatively, the price of $ETH experienced a 2.2% decrease over the period.

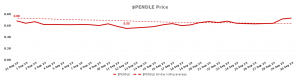
In this period, $PENDLE has outperformed relative to it’s 60-day rolling average.
There was an estimated 1.8m ($1.1m) $PENDLE given out as rewards.
The $PENDLE token managed to reverse the previous cycle’s downtrend, and had a positive price action this cycle.
Price volatility was in line with the majority of competitors, and performed similarly with $CVX, a major protocol in the yield sector.
The $PNP token significant outperformance is most likely due to PIP #5, which proposes the usage of Penpie’s swap fee revenue to buy back $PNP.

Pendle has implemented a vote escrow model, where $PENDLE holders can lock tokens for up to two years. The longer the lock duration the more $vePENDLE a user gets.
For more information on locking $PENDLE, you can read about it in our Pendle breakdown.

There was a decrease in the total $vePENDLE Supply balance. It opened with 28m, and closed at 27.9m, a decrease of 0.2%.
Similarly, there was a decrease in the total $PENDLE staked balance. It opened with 38.1m, and closed at 37.6m, a decrease of 1.4%.
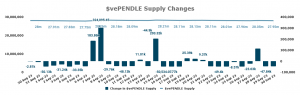
Over the period $2.5k was distributed to $vePENDLE holders
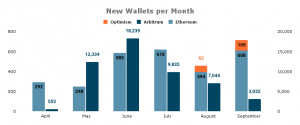
During the current period there were 3.8k new wallets that interacted with Pendle, bringing the annual total for new users to nearly 56k.
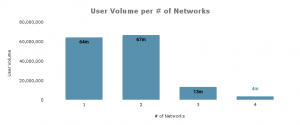
Since its launch, 56.5% of Pendle users are active on the protocol on more than one network. This figure is up from 48% at the end of August, a 15% increase.
There were no significant governance proposals during the period.
There were several notable news events in the period:
Revelo Intel has a commercial relationship with Pendle and this report is part of that relationship.
The Revelo Intel team members, including those directly involved in the analysis above, may have positions in the tokens discussed.
This content is provided for educational purposes only and does not constitute financial or investment advice. You should do your own research and only invest what you can afford to lose. Revelo Intel is a research platform and not an investment or financial advisor.