

Published: September 7, 2023
The Pendle protocol enables permissionless tokenization and trading of yield. It allows anyone to purchase assets at a discount, and obtain a fixed yield, or long DeFi yield.
Pendle has a presence on 5 networks and, in terms of TVL, it is currently the fourth-largest protocol in the yield sector.
This report covers the period from August 1 to August 31.
Key Performance highlights
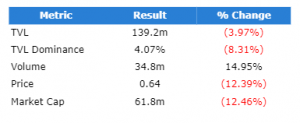
Pendle opened at $144.9m and closed at $139.2m, a $5.8m (3.97%) decrease over the period.
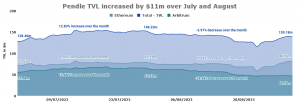
However, over the two months of July and August, TVL has increased by $10.7m (8.35%).
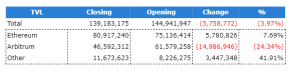
The $80.9m on Ethereum and the $46.6m on Arbitrum represent 58.14% and 33.48% of the total.
At a network level, the largest change was on Arbitrum which experienced a $15m (24.34%) decrease in TVL.
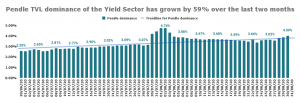
In July the Yield sector saw significant changes in the month. The two notable events were:
Since then Convex has been able to recover a significant percentage of its sector dominance. The same is not true for Conic, their market share has continued its decline.
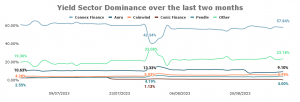
Pendle’s TVL dominance peaked in early August. Over the last two months dominance in the sector has continued to increase.
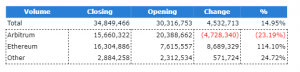
The volume in the month was $34.8m, a $4.5m (15%) increase from July.
At a network level, Ethereum had the highest volume ($16m) representing 47% of protocol volume. The $15.7m volume generated on Arbitrum contributes 45% to the total volume.
The average Capital Efficiency Rate* for the protocol over the period was 0.25%, with a daily high of 2.56% and a daily low of 0.22%
The graph below illustrates the daily volume (at a network level) and the capital efficiency of the protocol.
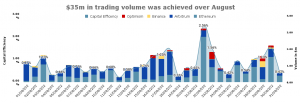
*Capital Efficiency is an indicator of how efficiently TVL in liquidity pools generates volume. It is calculated by taking the volume divided by TVL and converted to a percentage. It is a measure of how productive funds are at generating volume, but it is not a direct indicator of revenue. Higher capital efficiency does not mean higher revenue
On August 31 the largest liquidity pools were:
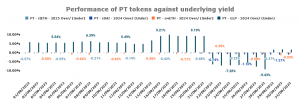
Holding the Principal Token (PT) enables you to redeem the principal amount after maturity; one PT can be redeemed for one underlying unit at maturity.
When it comes to trading PT tokens:
It is important to remember that, while the implied yield for PT changes, you lock in the rate at the time of purchase.
You can find out more about PT tokens in our Pendle Breakdown.
The chart below illustrates your position if you acquired a PT token on the respective day for each of the four largest pools.
A positive percentage: means that the implied yield was greater than the underlying yield, therefore traders would have been better off purchasing the PT compared to the underlying asset. The opposite is true for negative percentages
Please note: The profit and loss spreads only apply if traders hold until maturity.
The key takeaways are:
Holding the Yield Tokens (YT) enables users to continuously earn the yield produced by the underlying asset. It can be claimed in real-time up until maturity.
When it comes to trading YT tokens:
It is important to remember that YT tokens earn the yield of the underlying asset.
You can find out more about YT tokens in our Pendle Breakdown
The chart below illustrates your position if you acquired a YT token on the respective day for each of the four largest pools.
A positive percentage: means that the underlying yield was greater than the implied yield, therefore traders had a higher likelihood to make a profit. The opposite is true for negative percentages.
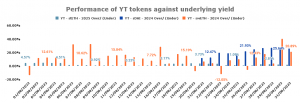
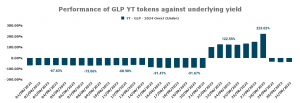
The key takeaways are:
There were no significant governance proposals during the period.
There was four notable news event that was published in the period.
1. Season 1 of the Pendle campaign launched
A campaign designed to teach users about Pendle while standing the chance to win prizes
For more information, you can read about it here.
2. PT tokens get added as collateral on Timeswap and Vendor Finance
The PT tokens for GLP and wstETH were made available for collateral for users to either leverage or borrow against.
For more information, you can read about it here and here.
3. Pendle launches on Optimism
Pendle was deployed on Optimism, its second expansion in as many months.
For more information, you can read about it here.
4. RWAs come to Pendle
RWA is already one of the fastest growing sectors, supporting fUSDC and sDAI brings together Fixed Yield and RWAs
For more information, you can read about it here.
5. Binance Labs invests in Pendle
Binance Labs is committed to supporting innovative projects that are set to shape the next generation of DeFi primitives.
The funds will be utilized to extend Pendle Finance’s reach across various blockchain ecosystems, providing both retail and institutional users with inclusive access to DeFi yield opportunities.
For more information, you can read about it here.
6. Pendle releases LP report
Pendle conducted a study on the IL impact of being an LP on pendle vs holding non-yield bearing ($ETH) and yield-bearing ($stETH) assets. This was part 1 of a 2-part report.
For more information, you can read about it here.
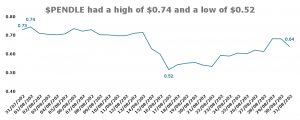
The $PENDLE token opened the month at $0.73 and closed at $0.64, a 12.39% decrease.
The highest daily close was $0.74 (Aug 01) while the lowest was $0.52 (Aug 17).

Over the month, the price of $PENDLE followed that of $ETH, whose monthly change was a decrease of 11.4%
 Source: Price – CoinGecko
The circulating market cap followed the same trend as the price, opening at $70.6m and closing at $61.8m. Pendle holds the 346th rank for circulating market cap on CoinGecko.
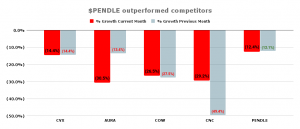
Of the top five protocols in the Yield Sector, $Pendle had the best price performance for the month. $AURA, $COW and $CNC all experienced decreases significantly higher than $ETH.
The month of June saw 1.88m $PENDLE issued as reward incentives, with an approximate value of $1.24m
Pendle has implemented a vote escrow model, where $PENDLE holders can lock tokens for up to two years. The longer the lock duration the more $vePENDLE a user gets.
For more information on locking $PENDLE, you can read about it in our Pendle breakdown
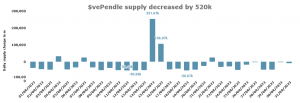
Over the month there was a 374k increase in the number of $PENDLE tokens locked, a 1% growth in the balance. However, there was an overall reduction in the vePENDLE supply of 521k (1.8%) over the same time period.
$vePENDLE holders benefit from the various revenue streams of the protocols. Over the month of August, $15k in $ETH was earned.
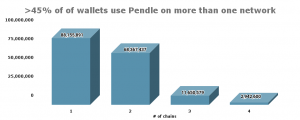
Since its launch, over 48% of Pendle users are active on the protocol on more than one network.
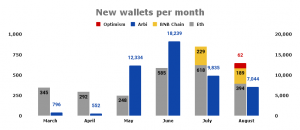
Since the start of the year 52k new wallets have engaged with the protocol. The graph below illustrates how strong user adoption has been since March.
Revelo Intel has a commercial relationship with Pendle and this report is part of that relationship.
The Revelo Intel team members, including those directly involved in the analysis above, may have positions in the tokens discussed.
This content is provided for educational purposes only and does not constitute financial or investment advice. You should do your own research and only invest what you can afford to lose. Revelo Intel is a research platform and not an investment or financial advisor.