
Published: July 17, 2023
Aave is the leading lending market in DeFi generating fees almost 3 times that of its closest competitor.
This report takes a look at the performance of Aave over the 31-day period from June 10 to July 9, 2023.
It will cover the key metrics of the protocol, the $AAVE token, the safety module, and other events.
The TVL for a lending market can be viewed in two ways:
The difference between the two is that net deposits look at the total gross deposits less the total borrowed. Our view is that net deposits are a fairer reflection of TVL and unless specifically stated otherwise, TVL references refer to the net number.
AAVE opened the period with $5.3bn in TVL and closed at $5.8bn, representing a 9.26% increase in TVL for the 31 days. This continued the momentum from the previous 31-day period which saw a 4.54% increase in TVL.
The protocol has its TVL allocated between three versions: v1, v2, and v3. TVL on Ethereum remains the biggest contributor of Aave’s TVL this period, with v2 consisting of the majority. The contribution to the $5.8bn of TVL is as follows:
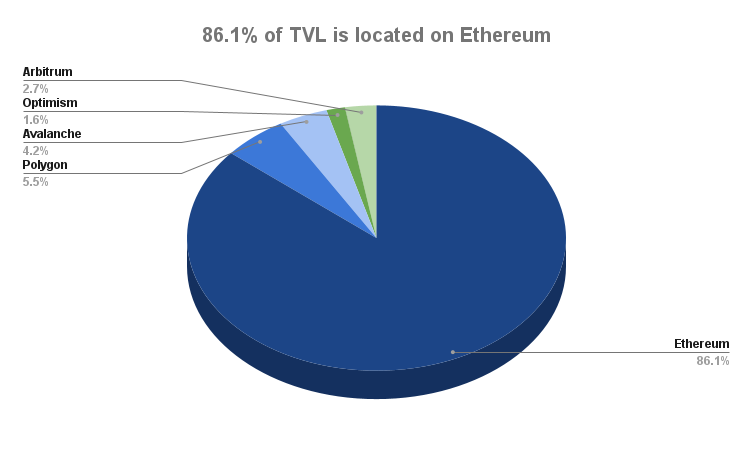
TVL of v2 on Ethereum opened the period at $3.51bn and experienced a $132m (3.70%) increase, closing at $3.68bn. TVL of v3 on Ethereum opened the period at $1bn and experienced a $339m (33.87%) increase, closing at $1.34bn.
At a token level, the drivers behind the changes were:
The main driver behind the increase in TVL for the above tokens is most likely:
The graph below shows the change in TVL balances for net deposits of the protocol, Ethereum v2 net deposits and Ethereum v2 borrows over the 31 days.

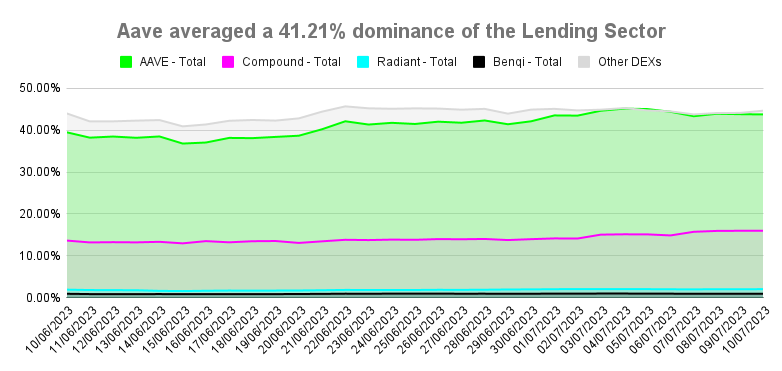
Over the period, Aave saw an increase of 4.25% in its TVL dominance of the lending sector.
It opened the period at 39.50% of the total TVL and closed at 43.75%. None of the other highlighted competitors saw a decrease in dominance. The lending sector dominance is still largely held by Aave’s control of 43.75% of the total TVL.
At the end of the 31 days, Gross Deposits totaled $8.6bn, where the average balance was $8.2bn.
The table below illustrates the tokens that are most used on the protocol across all three versions. They account for 95.27% of Gross Deposits and 97.12% of borrowed tokens.
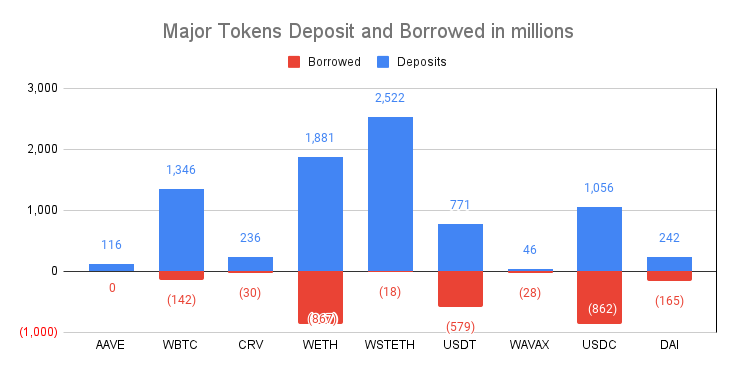
At $2.52bn, wstETH is the largest contributor on the supply side. The $1.88bn from ETH is the second largest and together ETH related tokens amount to $4.34bn of Gross deposits.
ETH ($1bn) and USDC ($0.8bn) are popular markets on the borrowing side.
The Interest Rates represent the return you would get if the current conditions stayed constant for a full year. Interest is earned on the supply side and paid on the borrowing side. For more information on how the interest rates are determined, you can read our Aave Breakdown.
Aave generates revenue based on the spread between the borrow side interest vs the supply side interest. In other words, Interest charged to borrowers less Interest paid to depositors = Interest earned.
On average the $ETH markets offer the highest returns to the protocol.

In addition to this, the returns on the other three largest supply-side markets ($USDC, $wBTC, and $wstETH) are as follows


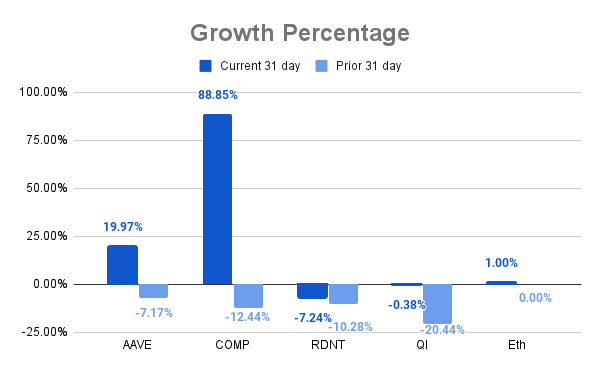
During the 31 days, the $AAVE token opened at $59.84 and closed at $71.79, with its highest price at $77.04. The total movement for the period was an increase of 19.97%, a reversal of the previous period’s decrease of 7.17%.
The circulating market cap followed the same trend as the price, opening at $863m and closing at $1bn, with an increase of 20.2%.
CoinGecko ranks $Aave as the 41st largest protocol based on circulating market cap.
$AAVE has a relatively low emission rate, only 1.1k new $Aave are minted per day and they are all allocated to the Safety Module. As a result, the protocol does not pay for the TVL in the lending market.
Except for $COMP, $AAVE performed well compared to its competitors who were unable to reverse their previous cycle’s downtrend.
The total value staked in the Safety Module saw an increase of $46m (15.68%) over the 31-day period, which is correlated to the price increase of $AAVE during the same period. This was a reversal of the decrease from the previous period.
The Saftey Module consists of two tokens:
You can read more on the Safety Module in our Aave Breakdown.
Over the 31 days, the average balance of $stkAAVE was $201m and $stkABPT was $101m. In the graph below we can see there were no volatile changes in the staked balances.

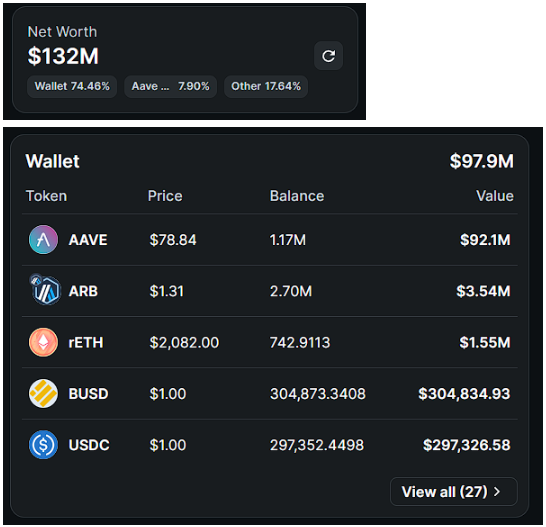
At the time of writing, the treasury consists of $132m in assets, split between its wallet, Aave itself, Balancer, and Lido.
A significant portion of the wallet holding consists of the $AAVE token itself, at $92.1m (94%).
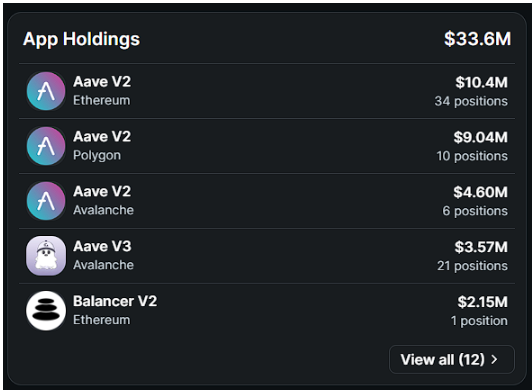
$33.6m of the treasury is deposited onto dApps, into the following allocation.
During the 31-day period, there were six governance proposals that were voted on. Here are some of the most significant ones.
1) Deprecate Aave V2 AMM Market
Given the low usage of the V2 AMM market and its risk/reward profile, Gauntlet recommends deprecating the Aave V2 AMM market.
The vote closed in favor of the proposal.
You can read the full details here.
2) Polygon Supply Cap Update
This AIP increases the stMATIC and MaticX Supply Cap on Polygon to 40M units and 38M units respectively.
The vote closed in favor of the proposal.
You can read the full details here.
3) Risk Parameter Updates Aave V3 Ethereum
A proposal to adjust fourteen (14) total risk parameters, including Loan-to-Value, Liquidation Threshold, and Liquidation Bonus, across six (6) Aave V3 Ethereum assets.
Assets affected are WBTC, WETH, WSTETH, LINK, DAI, and USDC on V3 Ethereum.
The vote closed in favor of the proposal.
You can read the full details here.
4) Chaos Labs V2 to V3 Migration Next Steps
This AIP proposes to Freeze the 1INCH, ENS, LINK, MKR, SNX & UNI reserves on the Aave V2 Ethereum pool
The vote closed in favor of the proposal.
You can read the full details here.
5) Polygon v2 – Parameter Update
This AIP will update risk parameters on Polygon v2 to encourage users to migrate funds to v3. No users’ funds are at risk.
The vote closed in favor of the proposal.
You can read the full details here.
6) Optimism – Create ETH eMode Category
This AIP if implemented will create an ETH-nominated eMode category on the Aave v3 Optimism deployment.
The vote closed in favor of the proposal.
You can read the full details here.
7) The following AIPs to add collaterals to markets were passed in this period.
For the period there were two notable news events:
1) Summer Finance introduces Aave v3 on mainnet
Summer Finance allows users to borrow, multiply, and earn on the assets they hold across multiple protocols.
For more information, you can read about it here.
2) A temperature check proposal for the GHO Stability Module (GSM) begins.
GSM’s unique features include adaptable Price Strategies, Debt Ceilings to limit exposure to certain assets, a Capital Allocator for potential yield generation, Last Resort Liquidations for managing increased risk, and Price Bounds/Swap Freezes for handling price deviation.
For more information, you can read about it here.
This report has highlighted the pricing trends and metrics for the period.
Over the 31-day period, Aave had good growth in TVL and it increased its dominance over the Lending markets sector
With the exception of Compound, the Aave protocol has continued its outperformance from its competitors in terms of price and without having to pay for emissions.
Governance action for the period has shown a strong and efficient focus on expanding available collateral types on V3.
We hope this report provides valuable insights into the performance of Aave and the $AAVE token.
Revelo Intel has never had a commercial relationship with AAVE and this report was not paid for or commissioned in any way.
Members of the Revelo Intel team, including those directly involved in the analysis above, may have positions in the tokens discussed.
This content is provided for educational purposes only and does not constitute financial or investment advice. You should do your own research and only invest what you can afford to lose. Revelo Intel is a research platform and not an investment or financial advisor.